Good Evening Everyone,
Its that time again. Let’s take a look at February of 2012.
The first image shows what happen globally with regard to weather hazards. If you click on the image below, you will able to see it much larger.

Next, let’s take a look at the Significant Events for the month of February. Click to view larger view.

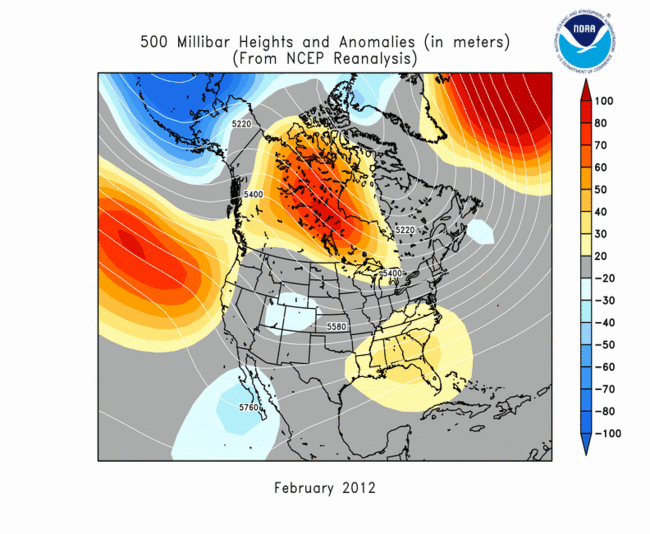
Next, let’s examine the 500mb Height and Anomaly map. When you look at the 500mb map, you can get a sense where ridges and troughs setup. The shades of red indicate ridging, while the shades of blue indicate troughing. Click on the map below to bring up February of 2011. Next let’s compare the two.
When you examine February of of this year to last year, there are some differences. There was more ridging over the West Coast into Central Canada. Over the Southeast US, ridging was stronger last year to this year. Overall, there was more ridging aloft over various areas of North America compared to last year.
Something extra I want to include this report and futures that I’ll do is provide some statistics for the following telleconnections for the month of February were the following:
NAO was mostly positive for this month.
– Out of the 29 days for this month, there were only two occurrence where values dropped below zero.
– Out of the 29 days for this month, there were 27 occurrences where values were positive. – Lowest value was -0.220 and highest value 1.023.
PNA was mostly positive for this month.
– Out of the 29 days for this month, there were only 5 occurrences where values dropped below zero.
– Out of the 29 days for this month, there were 24 occurrences where values were positive. – Lowest value was -0.646 and highest value 1.577.
AO was mostly positive for this month.
– Out of the 29 days for this month, there were only 2 occurrences where values dropped below zero.
– Out of the 29 days for this month, there were 27 occurrences where values were positive. – Lowest value was -0.220 and highest value 1.023.
SOI (Determines the strength of El Nino and La Nino), which we are in a La Nina phase was 2.5. La Nina is on the weakening phase.
Next, let’s take as we move from February to March of last year. Notice how much ridging took place over the Southwest US to Eastern US. The only area where height falls or trough setup was the Pacific Northwest. This pattern last year was very active with numerous severe weather, especially torandoes, large hail and high winds over southeastern parts of the US. 
Check out this report from last year. Click here…
So, that pretty much will do it for February of 2012. For a complete report for this month, head over National Climate Data Center.

