
Hi Everyone,
Check out the latest post from Don on whats going on with the weather pattern across the US. His latest post shows some insight that the prospects for a colder and stormier and even wintry time wil be shifting to the Eastern US.
Background Info: I’m very excited to share with everyone some very good weather discussions by Donald Sutherland. He’s a weather hobbyist and enjoys long weather forecasting. His posts are very good. I’m going to update this blog several times a week with his posts from American Weather. Speaking of American Weather, this is a a great site for discussing the weather, especially for meteorologists, weather hobbyists and anyone that follows the weather. I highly recommend you checking their site. Its a site that has a wealth of great weather information.
One additional note, I will have the most recent post from Don, followed by older posts. Again, this will be his winter weather discussions.
***********************************************************************************************************************************
Posted Saturday, March 2nd @ 9:23 PM
ack on 2/19 (Message #631), the analog pool that I used was indicating the potential for a snowy March in parts of North America. At that time, the analog pool was indicating the potential for a snowy March in parts of the Mid-Atlantic region and New England. Those analogs also suggested that the Ohio Valley, southern Ontario and southern Quebec would likely seek their most snowfall in March since 2011.
A week later, the analog pool was still bullish on that idea. As a result, I stated in #652 that the pattern is a potent one and I would be surprised if snowfall totals from at least Philadelphia to Boston are not above normal for March. The above normal figures could extend south to Washington, DC, west into the Ohio Valley, and north into southern Ontario and southern Quebec.
The major theme remains the blocky start to March. If the historic cases are representative, the blocking could persist through the March 10-20 timeframe. The 3/2 run of the GFS ensembles is pointing to such a scenario.
Some of the guidance, despite less than stellar run-to-run continuity, is now providing growing support for the idea of a significant March snowfall in interior portions of the Mid-Atlantic region. For example, the 3/2 18z run of the GFS suggests that Sterling, Virginia (IAD) could pick up 6″ or more snow. It also brings some accumulations into the Washington, DC (DCA) area, along with a very large amount of sleet. What’s important to note is that is according to the soundings. However, springtime snowstorms can have stronger dynamics, so the notion of a larger accumulation of wet snow cannot be excluded. In short, there is probably some possibility that Washington, DC could pick up 4″ or more snow.
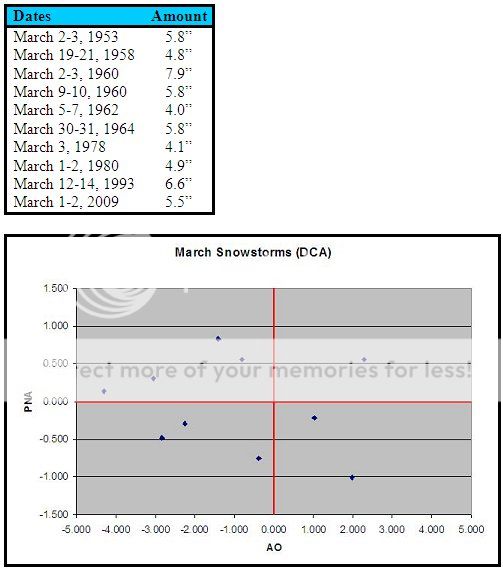
Since 1950, there have been 10 March snowstorms that brought 4.0″ or more snow to Washington, DC (DCA). In 7/10 (70%) of those cases, the Arctic Oscillation (AO) was < 0. The AO is likely to be strongly negative this time around. In addition, 40% of cases saw an AO-/PNA+ combination. That combination is forecast to be in place for the upcoming storm.
A snapshot of Washington, DC’s major March snowstorms since 1950 is below:
In the wake of the increasingly likely March 5-7 event, the pattern is likely to remain a potent one for winter weather, even if a temporary relaxation occurs. Hence, even if New York City and Boston miss out on the snow this time around, that that is not yet a foregone conclusion, the month could provide some additional opportunities given the persistent blocking.
In short, I have little reason to change my thinking concerning March at this point. If anything, I’m encouraged how things have been shaping up thus far.
***********************************************************************************************************************************
Posted Tuesday, February 26th @ 7:05 PM
Briefly, the 2/26 18z run of the GFS was quite mild in parts of the U.S. during the March 5-12 timeframe. IMO, the colder look on the 12z operational ECMWF and 12z ECMWF and GFS ensembles is probably more likely to verify assuming the blocking develops as forecast.
If one examines the GFS ensembles, there is strong agreement that a period of severe blocking (AO of -3 or below) is likely. That outcome, if it materializes, is typically cold almost nationwide.
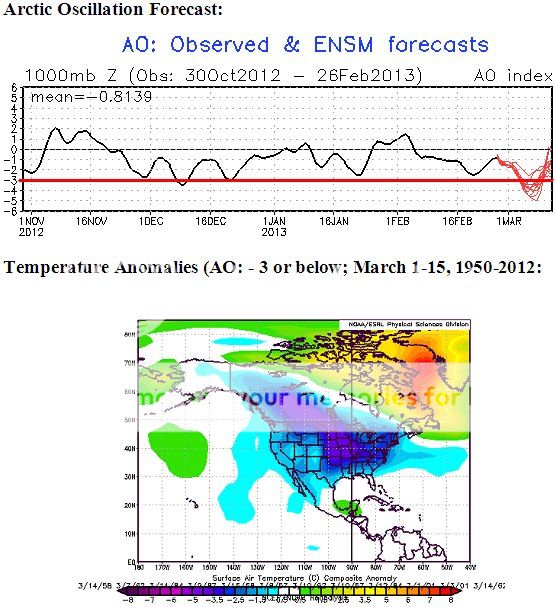
The latest run of the CFSv2 (Message #652) is in reasonable agreement with the composite temperature anomalies associated with that magnitude of blocking. Hence, at this point in time, I believe the 18z run of the GFS is likely to be an outlier.
***********************************************************************************************************************************
Posted Tuesday, February 26th @ 4:04 PM
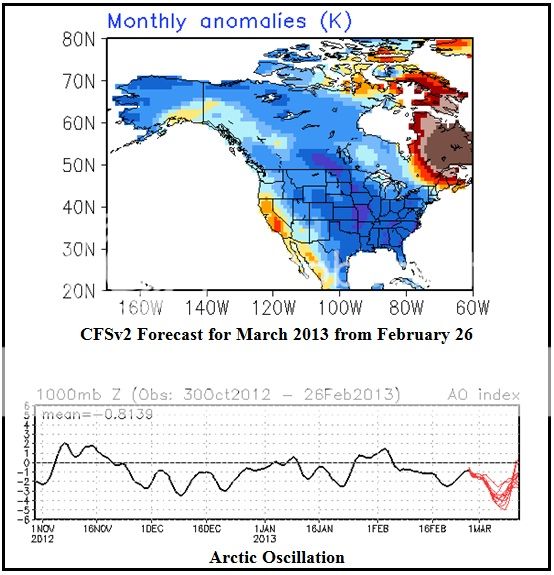
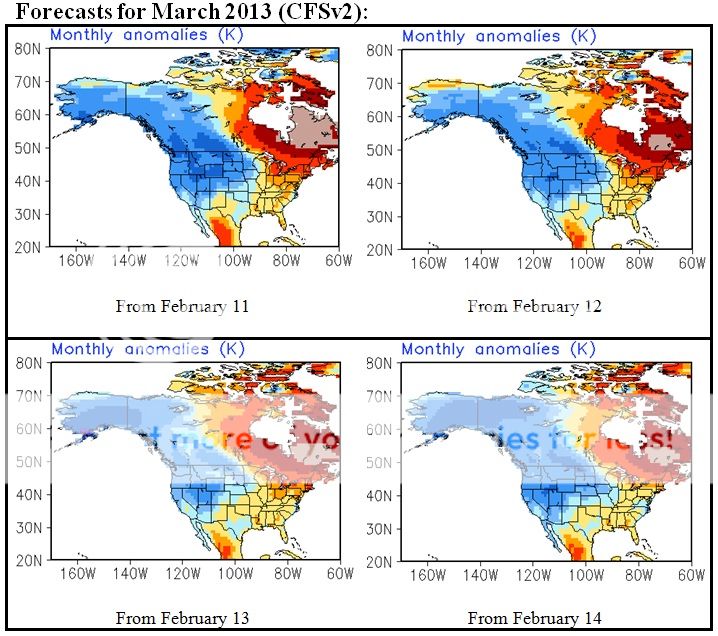
Since February 19 (#631) when I discussed the CFSv2 model’s coming into agreement with the ENSO-teleconnection analogs, that model has continued to trend colder nationwide for March. At the same time, the GFS ensembles have moved into strong consensus that a deep blocking regime is about to unfold and that the blocking regime likely will last for an extended period of time. The idea of a long-duration block that could last into the March 10-20 period was set forth in #639.
Below are the latest forecasts from the CFSv2 for the March anomalies (the CFSv2 has demonstrated skill at this timeframe) and the GFS ensembles for the Arctic Oscillation.
1960 remains among my leading analogs. In terms of the objective analogs, 3/11/1958, 2/17/1969, and 2/17/2010 are showing up for the 8-day period centered around March 6. KU snowstorms occurred in all three years 5-8 days after the dates shown. March 1960 also had a blizzard. In short, the pattern is a potent one and I would be surprised if snowfall totals from at least Philadelphia to Boston are not above normal for March. The above normal figures could extend south to Washington, DC, west into the Ohio Valley, and north into southern Ontario and southern Quebec. Later in the month, perhaps in a fashion not dissimilar from how the pattern evolved in March 2009, I suspect that the Plains States could again be at risk of a significant snowfall.
***********************************************************************************************************************************
Posted Saturday, February 23rd @ 10:02 AM
The latest run of the NAEFS is now in good agreement with the temperature anomalies suggested by the CFSv2 and analog cases that were posted a few days ago (#631).
CFSv2/Analogs:
NAEFS (2/23/2013 0z):
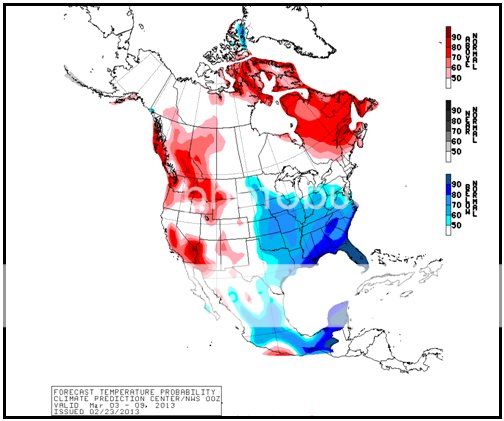
In short, support for at least a cold start to March in the East, consistent with the dual PNA-AO/NAO blocks consistently signaled on the ensembles, continues to grow. If the MJO can finally break out of its “Phase 4-Phase 5 prison,” opportunities for a widespread moderate to significant snowfall could increase.
***********************************************************************************************************************************
Posted Friday, February 22nd @ 10:28 AM
With the GFS having led the way in “calling off” what once looked to be a promising southern New England snowstorm, the ECMWF and finally NAM have moved into agreement with the GFS today. I suspect that the storm’s great “vanishing act”, in spite of strong blocking (AO: -1.957; NAO -1.149), is the result of the MJO. At last word, the MJO was in Phase 4 and at high amplitude (1.949).
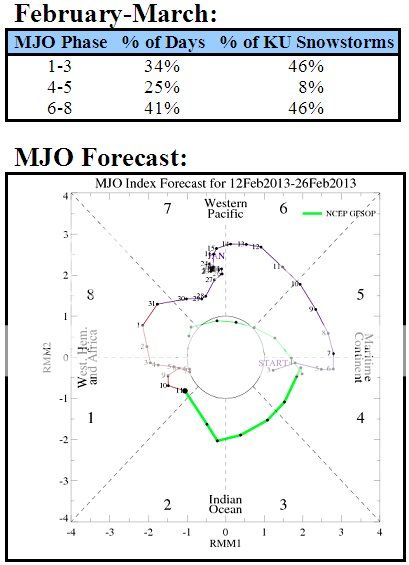
Phases 4 and 5 are terrible for KU snowstorms in the February-March timeframe. Since 1950, the following is the breakdown of KU snowstorms based on MJO phases:
Phases 1-3: 50% (includes the Blizzard of 2013)
Phases 4-5: 7%
Phases 6-8: 43%
Some of the guidance keeps the MJO locked in Phases 4 or 5 through March 8. If that’s the case, prospects for a KU snowstorm during the first week of March could be low. That does not mean that it cannot snow, just that a KU-type snowstorm would be unlikely.
Having said that, given the analog cases that have been coming up, I continue to have reasonable confidence that March 2013 could be the snowiest since March 2009 in some parts of the East. Whether or not a KU storm would occur is a different matter, but at least one of the analog cases had such a storm.
The idea of a colder than normal start to March remains on track. With blocking forecast to grow stronger through the medium-term, one cannot rule out the prospect of an Arctic air mass moving down out of Canada at some point during the first 7-10 days in March.
***********************************************************************************************************************************
Posted Friday, February 22nd @ 12:27 AM
Some late evening thoughts…
Perhaps lending support to the ideas expressed in Message #631, some of the ensemble guidance is now suggesting that the EPO could go negative during the first week in March. If that happens, prospects of at least a period of cross-polar flow could increase.
The 2/22 0z run of the GFS is suggesting that a very cold air mass could move into the eastern U.S. during the first week in March. The forecast 2 meter temperatures on that model would be the coldest since March 2009. What’s more that model forecasts such readings with little or no snow cover in the Mid-Atlantic region. The GFS has sometimes been too aggressive with the cold, so even if such readings do not materialize, the idea that the month could get off to a cold start is not unreasonable.
The blocking (AO-) regime that got underway on February 6 is likely to persist for some time. Since 1950, there have been 6 cases on which February blocks formed, the AO fell to at least -2.5 in February, and December had also seen the AO average -0.50 or below. In 67% of those cases, the blocking regimes that commenced in February lasted 36 days or longer. 50% of those blocking regimes lasted more than 40 days. The mean figure was 34.3 days and the median figure was 39.5 days. Hence, it is plausible that the ongoing blocking could last into the March 10-20 timeframe. That outcome would further reinforce the idea of a cold start to the month. The six prior cases were 1962, 1964, 1969, 1970, 1986, and 2001.
***********************************************************************************************************************************
Posted Tuesday, February 19th @ 10:23 AM
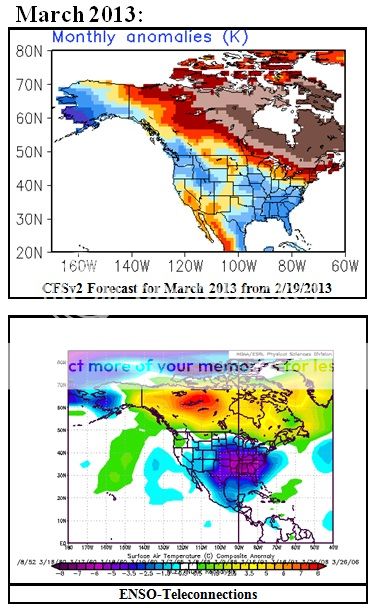
The latest CFSv2 forecast is now remarkably similar to what is showing up in the analog cases based on ENSO-teleconnections for March.
It should be noted that the analog cases are better at illustrating areas of cold-warm anomalies than magnitude. The base climate regime of 1981-2010 is not the same as the earlier climatic base from which a number of the analog cases have been drawn.
Top 3 cases showing up: 1960, 1965, and 2006. 2006 has been declining in weight recently.
FWIW, the current mix of analog cases suggests the potential for a snowy March in parts of the Mid-Atlantic region and New England. The Ohio Valley, southern Ontario and southern Quebec would likely seek their most snowfall in March since 2011.
March snowfall for select cities based on the analog cases (weighted for frequency of cases):
Boston: 9.7″ (snowiest since 2009)
Cleveland: 10.8″ (snowiest since 2011)
Montreal: 26.0 cm/10.2″ (snowiest since 2011)
New York City: 7.2″ (snowiest since 2009)
Toronto: 21.7 cm/8.5″ (snowiest since 2011)
Washington, DC: 6.8″ (snowiest since 1999); excluding 1960: 2.2″ (snowiest since 2009)
Analog cases should not be used for making precise estimates of snowfall. What the above figures are useful in illustrating is the big picture idea that March could be snowier than usual in the Mid-Atlantic and New England regions and that the Ohio Valley and parts of southern Canada should see a much snowier March than last winter.
***********************************************************************************************************************************
Posted Friday, February 15th @ 4:32 PM
Some quick thoughts…
1. The weekend system that is likely to develop somewhere off the Southeast coast and then rapidly intensify as it heads north-northeastward is likely to develop too far offshore to pose much of a threat to the Mid-Atlantic and southern New England regions. A period of accumulating snow is likely across eastern Long Island and eastern New England. However, the GFS has probably been forming the storm too close to the coast and remains an outlier at this point.
2. Much of the rest of February is likely to be blocky. Some guidance supports the development of a strong NAO-/AO- regime. Hence, especially if the MJO maintains its progression forecast to take it through Phases 4 and 5 in coming days, the pattern could become more conducive toward a more widespread East Coast snowfall than appears likely this weekend.
3. The development of blocking supports the idea showing up in some analogs that March is not a slamdunk for warmth in the east. March is likely to be cold in the West. The East remains uncertain and there are colder analogs in the mix. In the meantime, the CFSv2 has continued to shift toward a colder outcome in the East.
***********************************************************************************************************************************
Posted Thursday, February 14th @ 2:08 PM
Yesterday, I noted in #597 that even as the CFSv2 has recently been suggesting a warm month in the Northeast (cold in the Pacific Northwest), my emerging pool of analogs is more mixed in the East. The idea of cold in parts of the west is well-supported in the early pool. However, in the East, there’s less consensus on warmth.
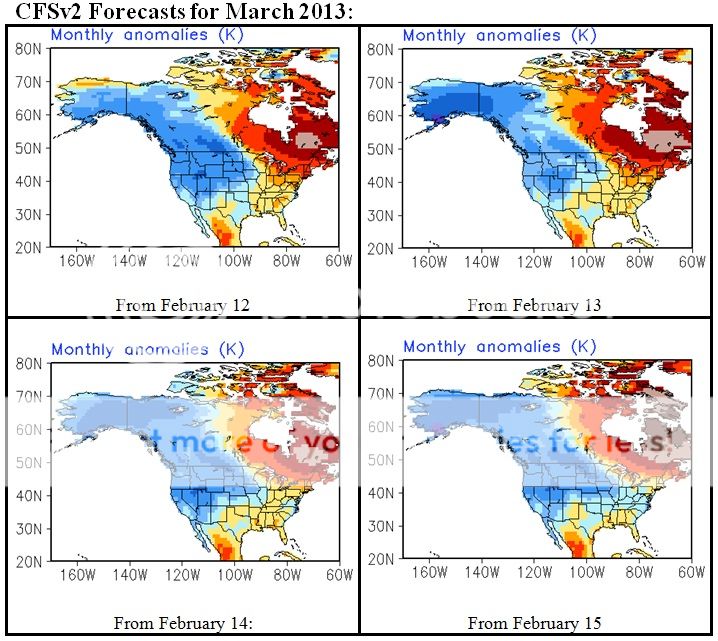
Today’s run of the CFSv2 has shifted a little and is indicated that cool anomalies might prevail in the Mid-Atlantic region in March. The last four runs of that model are below:
At this point, the details are not very important. What is important is that the changing outcomes in parts of the East might reflect the uncertainty among the early pool of analogs.
Looking at some of the drivers, there is now a split in the guidance concerning the MJO. Some guidance shows the MJO moving into Phases 4 and 5 and basically stalling out toward the end of February. Other guidance maintains the MJO’s progression. What happens could have a significant impact on the temperature anomalies. For example, last March saw the MJO in Phases 4, 6, and 7 for 21 days. March 2012 was the warmest March on record in the CONUS.
***********************************************************************************************************************************
Posted Tuesday, February 12th @ 2:26 PM
Recently, there has been speculation concerning a possible chance for a major East Coast snowstorm for the February 17-19 timeframe. Fueling that speculation was a forecast on the GFS ensembles for major trough amplification in eastern North America around that timeframe. However, odds are much against such an outcome. There is good agreement among the GFS, Canadian, and ECMWF guidance that the MJO will likely be in Phase 4 during that timeframe.
Phases 4 and 5 do not favorable phases of KU-type snowstorms, even as the March 1993 superstorm occurred during Phase 4 and the 1979 President’s Day snowstorm occurred during a transition from Phase 3 to Phase 4.
The above chart shows that KU snowstorms are greatly overrepresented in Phases 1-3 and somewhat overrepresented in Phases 6-8. In contrast, they are greatly underrepresented in Phases 4-5. If that data is reasonable and the MJO forecasts are accurate, and exceptions can occur, one probably won’t see the chance of a KU snowstorm until the period beginning 2/21 at the earliest.
With Phases 6-8 perhaps representing the next chance for which such a storm can reasonably be considered, it should be noted that 83% of February-March KU storms during those MJO phases occurred with an amplitude of 1 or above. Moreover, all of the February-March KU storms that occurred during Phases 6-8 commenced when the Arctic Oscillation was negative (83% when the AO was -1 or below and 67% when the AO was -3 or below). Therefore, one would probably want to see prospects for blocking and preferably strong blocking by 2/21. There is some ensemble support for such an outcome in terms of blocking, but there is no strong ensemble consensus right now.
The near absence of KU snowstorms in Phases 4-5 does not mean no opportunities for snowfall. There have been moderate-to-significant storms that fell short of KU classification. There have also been near misses. Recent examples include February 6-7, 2003, February 3-4, 2009, and March 1-3, 2009.
In sum, I have little reason to depart from my thinking expressed earlier in this thread (e.g., #570) that the Ohio Valley, Mid-Atlantic region, and New England will see additional snows. That includes snowfalls after the modest 2/13-14 event. However, if one is hoping for a blockbuster East Coast event, one should not be looking to this weekend. I’m not surprised that the ECMWF is unimpressed with the 2/17-19 timeframe. Instead, better prospects might exist beginning around February 21 based on the MJO forecast and historic MJO data.
***********************************************************************************************************************************
Posted Thursday, February 7th @ 8:55 AM
With a Kocin-Uccellini (KU) snowstorm imminent across at least a large part of southern New England and perhaps the northern Mid-Atlantic, it is a good time to reflect back on possible early hints in the run-up to the winter. Needless to say, sample sizes are small, but the hint that the winter had at least some chance of a KU snowstorm were striking.
From Message #7 (11/24):
More recently, the AO averaged -1.514 during October. Since 1950, there were 8 prior cases during which the AO averaged -1.000 or below during October. 6/8 (75%) saw the winter AO average < 0.
From that pool of 8 cases, 4 saw the AO fall to -2.000 or below during the December 1-10 period, as is forecast to occur by a majority of ensemble members.
All four (1966, 1981, 2002, and 2009) saw the AO average < 0 during the winter. 3/4 (75%) of those winters experienced a KU snowstorm. The exception (winter 1981-82) saw a springtime KU snowstorm (the April 1982 blizzard).
From Message #25 (11/26) several major blocking patterns similar to what ultimately unfolded during winter 2012-13 were highlighted. The relevant text:
Recent examples include the blocking regimes of 2009-10 and 2010-11. The following severe blocking episodes (minimum AO value of -3.000 or below) began in late November/early December (11/20-12/10) following a blocky October (monthly AO of -025 or below):
December 7, 1966-January 11, 1967: 36 days
December 7, 1981-January 12, 1982: 37 days
November 29, 2009-January 15, 2010: 48 days
December 3, 2010-January 15, 2011: 44 days
Winter 2012-13 Case:
October Mean AO Value: -1.514
Block: November 24, 2012 through January 2, 2013; Duration: 40 days
Lowest Value: -3.902, December 8, 2012
After what seemed like a death march through a barren desert of warmth and then dry, cold—anything but significant snowfall—1967, one of the above-mentioned blocking cases, surged to the head of the proverbial pack as my lead analog for February.
From Message #535 (January 22):
Based on ENSO (neutral to borderline La Niña conditions for February and the teleconnections into early February/weight given to some of the past years for teleconnections similar to those of this winter), the most persistent teleconnection analog for February is 1967…
In terms of snowfall, February will probably prove to be the snowiest month of the winter. Snowfall in the Middle Atlantic and New England regions and possibly Ohio Valley could be above normal.
1967 featured a KU snowstorm during the February 5-8 timeframe.
Barring radical changes in the modeling, a KU snowstorm appears highly likely for southern New England. In some part of the region, snowfall amounts could approach historic proportions if some of the guidance, including the ECMWF, proves accurate. Heavy snowfall could also extend into the northern Mid-Atlantic (northern New Jersey, southeast New York State and across Long Island).
If some of the early hints, including the unseasonable early snowstorm in the NYC metro area, prove reliable, this storm likely will not bring the last snowfall to the Middle Atlantic and New England areas. From Message #6:
To date, November 2012 has seen 4.7” snowfall in New York City. There were six such cases since 1869: 1882, 1892, 1896, 1898, 1938, and 1989. 5/6 (83%) saw an additional 24.5” or more of snow accumulate during the season and 4/6 (67%) saw 30” or more additional snow. The single exception was winter 1989-90, which came to an abrupt end after a cold, snowy start.
Even if the 2/7 0z ECMWF verifies for the New York City area, seasonal snowfall is not likely to reach the levels cited above. Hence, should such information prove accurate, one could look for additional snowfalls, even if there is a pause for a time. Indeed, March 1967 also proved very snowy in such cities as New York and Boston.
The latest guidance shows that the potential is there. On the ensemble guidance, one finds the EPO forecast to go negative through at least the third week in February. The guidance has also come into stronger agreement that blocking (AO-) will unfold. If one also takes a look at the objective analogs for the 2/7 0z run of the GFS ensembles, the lead analog for centered on February 17 is February 12, 2006. Recent operational runs of the GFS have hinted at the possibility of above normal snowfall in the Ohio Valley and possibly eastward.
In sum, after a long sleep, winter has awakened.
***********************************************************************************************************************************
Posted Tuesday, February 5th @ 11:25 AM
February Update…
With the first week of February almost completed, I have no major changes from my thoughts for the month expressed in Message #535 in this thread. Briefly, the temperature anomalies shown from the teleconnection analogs were as follows:
The temperature anomalies for first three days of the month (NCEP’s re-analysis charts don’t go beyond February 3) were as follows:
To date, my lead analog (1967) remains in play. Hence, my confidence that the month will wind up on the cold side of normal, not necessarily extreme, and snowier than normal for the Mid-Atlantic, New England, and possibly Ohio Valley has increased. Recent runs of the ECMWF and the 2/5 12z run of the GFS don’t undermine that growing confidence.
Moreover, repeated runs of the ensembles have indicated that the EPO should turn negative and possibly sharply negative as the calendar approaches mid-month. There has also been a growing signal for renewed blocking (Arctic Oscillation) in the medium-term, along with a continued neutral to somewhat positive PNA. In short, at least at this point in time, my February thoughts appear to remain on track.
All said, what a difference a year makes. At this point last year, February was already accumulating coast-to-coast warm anomalies en route to becoming the 16th warmest February on record (CONUS) and 5th warmest on record in the Northeast. At least in my opinion, the almost daily coatings for snow from fast-moving clipper systems is far better than last year’s march through seemingly unending warmth.

February 3, 2013
***********************************************************************************************************************************
Posted Tuesday, January 22nd @ 11:50 PM
At 11 pm, temperatures included 20° in Washington, DC, 16° in Philadelphia, 14° in New York City, and 15° in Boston. Winter’s coldest period, likely to stretch 3-4 weeks from this point into the middle or perhaps latter part of February has probably gotten underway.
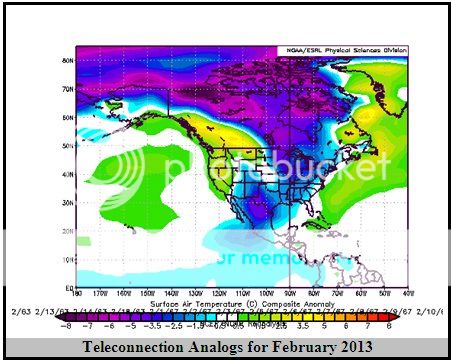
Based on ENSO (neutral to borderline La Niña conditions for February and the teleconnections into early February/weight given to some of the past years for teleconnections similar to those of this winter), the most persistent teleconnection analog for February is 1967. The second one is 1963. A distant third was 1962. Those analogs suggest that the eastern half of the U.S. and southern Canada could be colder than normal for February.
My latest teleconnection analogs for February 2013 result in the following temperature anomalies:
All three of those years saw some frigid readings in that area during the first half of February. 1963 saw the cold last through much of the month. Needless to say, the baseline temperature normals (1981-2010 vs. 1951-80) have warmed. Nonetheless, even taking that into consideration it is likely that the coldest reading could be near 0° in Boston (a subzero low cannot be ruled out), between 7° and 12° in New York City and Philadelphia, and probably between 12°-17° in Washington, DC by the worst of the cold ends by mid-February.
Nationwide, February 1967 was the 48th coldest February on record. However, in the Northeast it ranked 17th, Ohio Valley 27th, and Southeast 25th. While I don’t believe readings will approach the levels of 1967 given the contemporary baseline norms, the important point is that the Ohio Valley, Northeast (New England/Mid-Atlantic), and Southeast could be colder and perhaps much colder than today’s norms.
In terms of snowfall, February will probably prove to be the snowiest month of the winter. Snowfall in the Middle Atlantic and New England regions and possibly Ohio Valley could be above normal.
1967 featured a KU snowstorm during the February 5-8 timeframe. During the onset of the snowstorm, the GWO was in Phase 4, the AO was neutral and the PNA was positive (a PNA and AO scenario that is plausible going into the first week in February according to the GFS ensembles). In terms of February KU snowstorms, Phase 4 was actually an uncommon one. Phase 8 was the most common (37%). Phases 6-8 accounted for 63% of February KU snowstorms. Phases 1-5 accounted for just 37% of KU snowstorms. Recently, the GWO was in Phase 5.
On account of the KU snowstorm, the Mid-Atlantic and New England areas were much snowier than normal in 1967. In contrast, 1963 saw much less snowfall, but that year featured an exceptionally cold February (among the 10 coldest in the Northeast and Southeast). 1962 saw above normal snowfall in the Mid-Atlantic region and much above normal snowfall in New England.
***********************************************************************************************************************************
Posted Tuesday, January 1st @ 10:43 AM
Some morning thoughts…
1.. Although the PNA went positive, my idea concerning an Arctic blast prior to the moderation that lies ahead will prove incorrect, even as the colder period has worked out.
2. The moderation is likely to be temporary (already there is a strong ensemble signal that the Arctic Oscillation, after going positive in the near-term could go negative by the end of the extended range). Some guidance also suggests a negative EPO by the end of the extended range, but there is more uncertainty.
With the warmest year since recordkeeping began in the CONUS now in the past, rather than reflecting back at the misery that year inflicted on snow geese, I will share a passage that was written by a woman from Monroe, Virginia following the wild, wintry weather of December 1839:
Never before did winter visit this sunny valley in such wrathful mood. He raved and roared, as from his chariot of the storm, he showered down snow and hail, and icicles, amid the shivering forests, which bent and bowed before his hurricane flight, as if but just broke loose from his drear arctic regions.
Once the cold returns, may winter “rave and roar” in its best fashion, showering down the snow in great abundance.
Happy New Year to all.
***********************************************************************************************************************************
Posted Saturday, December 29th @ 9:23 AM
Near Year-End Wrap Up…
A brutally warm year for North America is coming to a close. December has already produced some winter highlights in the Plains States, Midwest, and portions of Quebec. Madison and Montreal were among the cities receiving substantial snowfalls. A storm is currently poised to bring a moderate to locally significant snowfall to portions of New England.
Looking ahead, the PNA is continuing to rise. The long anticipated Arctic outbreak appears likely to occur during the first week in January. Ahead of the Arctic outbreak, some snow flurries and snow showers might occur, but a big storm probably won’t.
Portions of southern Canada and the eastern half of the U.S. will likely see their coldest readings of the winter so far. Some areas, perhaps including New York City, Albany, and Ottawa could see their coldest temperatures since Winter 2010-11. A subzero low in Albany and single-digit low in New York City (even with little or no snow cover) remain on the table.
However, after the Arctic outbreak, with the Arctic Oscillation likely to go positive and the EPO also likely to become positive, a period of moderation is likely to unfold, beginning in the Plains States and than spreading eastward. Unlike last winter, it does not appear that a bout of exceptional warmth is underway. More importantly, it is likely that this will be the kind of moderation that lasts about two weeks. Hence, winter will not come to an end. Moreover, January is likely to have cold monthly anomalies for perhaps the eastern two thirds of the U.S., as well as southern Ontario and southern Quebec.
Finally, the upcoming storm should not be viewed as a missed opportunity for snowfall from which lightly or non-impacted regions cannot recover. It is not a final verdict that Winter 2012-13 will continue the misery of a general absence of snowfall in those regions e.g., the Mid-Atlantic where the last snowy winter was 2009-10. There will be more opportunities for snowfall and analog cases continue to suggest that a KU-type snowstorm is not out of the question before the winter is completed.
***********************************************************************************************************************************
Posted Thursday, December 27th @ 2:58 PM
Several things:
1. The AO was predominantly negative during winter 1993-94 (60/90 days or 66.7% of the days). There was a 25-day block (12/23 through 1/16), an 18-day period where the AO was positive (1/17 through 2/3), and then another 25-day block (2/4 through 2/28). The severe cold in January briefly gave way to warmer than normal readings during the AO+ regime. Afterward, a cold and snowy pattern (more ice from the Mason-Dixon Line southward) developed in the East.
2. The NAO was positive for almost all of the winter (78/90 days or 86.7% of the days).
3. Given the historical experience with long-duration blocks similar to the current one and the ensemble signal, one probably can have confidence that the AO will likely go positive down the road. Whether such an outcome gives way to another round of sustained blocking remains uncertain at this time.
4. Despite hints of a possible sudden or even major stratospheric warming, there remains a lot of uncertainty. My read on the guidance is that it is mixed. There is no unambiguous signal right now for such an event. Moreover, even as such warmings can trigger the destruction of the polar vortex leading to blocking (top-down response), they can also occur as a result of a prolonged period of blocking (bottom-up response). Should such a warming occur, one would have to watch to see if it begins to translate to the lower levels of the atmosphere.
Having said this, I believe January will probably wind up colder than normal in the Mid-Atlantic region. 1994 is among the past cases coming up, though I don’t expect the cold of January 2013 to rival that of January 1994.
***********************************************************************************************************************************
Posted Thursday, December 27th @ 8:57 AM
Morning thoughts…
1. The PNA remains positive (+0.517). Its stretch of 49 consecutive days < 0 has ended.
2. The AO is currently -0.354. It has been negative for 38 consecutive days (a duration that is consistent with the blocking cases set forth in message #25 back on November 26.
3. The ensemble guidance suggests that the PNA will peak and then slowly head back to neutral levels in the extended range. The AO will very likely go positive, but the EPO will trend toward neutral levels.
All this sets the stage for a period of moderation probably beginning 1/10 +/- a few days (1/5 +/- a few days in the Plains States). This moderation is not likely to mark the end of the winter so to speak. However, a return to cold will likely depend more on the evolution of the PNA and EPO than the AO.
More immediately, the storm that brought more than 10″ snow to parts of Arkansas and a foot of snow to parts of Indiana will bring a significant snowfall to portions of northern New England today into tomorrow.
A second storm will likely bring a stripe of accumulating snow (perhaps moderate to significant) from the northern Mid-Atlantic region into southern New England on December 29-31. My thoughts on this storm remain unchanged from those of Message #332, namely that this storm has potential.
Currently, there is disgreement between the GFS and ECMWF/GGEM on the evolution of the weekend storm. Based on how I expected the pattern to evolve and also considering the ensemble guidance, I believe the ECMWF/GGEM will probably be closer to the outcome than the GFS. Therefore, I continue to think that a moderate to possibly significant snowfall form the northern Mid-Atlantic into New England is more likely than little or no snowfall in that area. A lot depends on whether phasing will take place (likely) and the timing (uncertain), but one would think that with its higher resolution the Euro might have somewhat of an edge in handling such events from this timeframe. The caveat is that the Euro hasn’t exactly been a rock of consistency, so much uncertainty remains.
Finally, the 12/27 6z GFS notwithstanding, I continue to expect an Arctic outbreak following the weekend storm during the first few days of January. A compromise between the outcome on the 12/27 0z GFS and 12/27 0z ECMWF might be reasonable (perhaps a little closer to the Euro’s idea). The season’s coldest readings to date should occur in many places. Some locations might see their coldest readings since winter 2010-11.
***********************************************************************************************************************************
Posted Sunday, December 23rd @ 5:48 PM
In this season of the “Fiscal Cliff,” there’s another “cliff” that has some snow geese increasingly anxious. For several days, the models have teased the snow geese, already starving from the non-winter of 2011-12, with possibilities of one or two large snowfalls. Since then, the guidance has evolved in ways that make Scrooge a model of charity. To them, a cliff suddenly looms over which they will tumble into premature spring.
But this is the Holiday Season. There’s no reason to despair. The joys of Hanukkah have already brightened an abnormally warm December to date. Christmas lies ahead in what is now a generally colder, but still not severely cold pattern. Gifts, in the form of a series of storms, will be unwrapped as 2012 draws to a close and 2013 begins.
The first will bring moderate to heavy snows across parts of Ohio and Indiana into southern Ontario on December 26-27. The next could bring a stripe of accumulating snow (perhaps moderate to significant) from the northern Mid-Atlantic region into southern New England on December 29-31 (timing still a little uncertain).
In the wake of the latter storm, a full-fledged Arctic outbreak appears increasingly likely, even if the GFS has waffled in Washington-style fashion. Blocking continues and the PNA is likely to go positive. The frigid air that has remained locked safely away across Alaska and parts of northwestern Canada will finally be dislodged. Some of that air will sweep across southern Ontario and southern Quebec and also tumble into the Continental U.S. With snow cover across the Ohio Valley and parts of the East Coast, there will be less moderation than would otherwise be the case. The season’s coldest readings to date will occur in many places. Some might see their coldest readings since winter 2010-11.
For now, even as Washington wrestles with the Fiscal Cliff, with perhaps a suboptimal, minimalist outcome the most likely scenario, GFS mirages notwithstanding, there is no cliff that will send the snow geese hurtling into another abnormally early spring. It bears repeating, this is not a replay of winter 2011-12.
***********************************************************************************************************************************
Posted Friday, December 21st @ 12:28 PM
Quick Thoughts…
On 12/15, some ensemble members had begun to hint that the PNA, which has now been negative for 46 consecutive days, could go positive near the end of December. Historical cases related to long-lived PNA- regimes also suggested that such guidance might have some merit. Today, there is developing consensus that the PNA is likely to go positive toward the end of the month or near the beginning of January.
The AO, which has again fallen below -3 is likely to remain negative through the extended period consistent with a number of long-lived blocking regimes, including those of winters 2009-10 and 2010-11.
With the blizzard departing the Great Lakes region after having brought more than 15″ snow to Madison and Chicago its first measurable snowfall since March 4, 2012, along with a surge of warmth and moderate-to-heavy rain in the East, the final pieces of a pattern change to generally colder than normal weather across much of the U.S. and southern Canada are now falling into place.
As the colder pattern unfolds, the active subtropical jet suggests that storminess could coincide with the cold. Hence, opportunities for at least some accumulation of snow appear likely.
Finally, once the PNA goes neutral and then probably positive, the risk of an Arctic outbreak could increase. The potential exists that sometime during the next 2-3 weeks, Albany could see its first subzero temperature since February 11, 2011 when the mercury fell to -5° and New York City could see its first single-digit reading since January 24, 2011 when the temperature fell to 6°.
***********************************************************************************************************************************
Posted Thursday, December 20th @ 12:33 PM
Large-Scale Pattern Change Imminent…
A blizzard is currently raging in parts of Iowa and Wisconsin. That storm represents yet another event in the ongoing evolution of the pattern that will culminate in a much colder pattern locking in over a large part of the United States and southern Canada. Already, parts of Wisconsin have picked up 10″ or more of snow. Strawberry Point has received 12.2″.
Meanwhile, this morning was the 6th consecutive day on which Fairbanks, Alaska registered a low of -40°F or colder. To date, the monthly mean temperature is a frigid -19.4°F (16.3°F below normal). However, there are hints on the ensembles and also the CFSv2 that Alaska could grow notably warmer in the extended forecast range. As that happens, Arctic air could press southward, leading to what will likely be a colder than normal January across much of the U.S. (except for perhaps the Southwest and Florida) and southern Canada, if the leading analogs are accurate. The CFSv2 has been signaling a cold January for some time now.
Such a break in the pattern featuring the warming in Alaska is not without precedent. For example, November 1977 saw Fairbanks come out with a mean temperature of -7.6°F (10.4°F below normal). November 2012 had very similar readings, with a mean temperature of -8.8°F (11.4°F below normal). The first 17 days of December 1977 were brutally cold in Fairbanks. The mean temperature was -32.8°F. 3 days had high temperatures of -40°F or colder. The lowest temperature during that period was -52° on December 13 and the highest temperature was -11°F on December 1. A rapid transition to milder condtions took place afterward. The December 20-31 period had a mean temperature of a toasty 10.8°F. 11/12 days had high temperatures above 10°F and 4/12 had highs in the lower 20s. 10/12 days had low temperatures above 0°F. The lowest temperature was -8°F on December 25 and the highest was 22° on December 26.
January 1978 had a mean temperature of +0.1°F (12.0°F above normal). January1978 had temperature anomalies that were fairly similar to those forecast on the December 20, 2012 run of the CFSv2 for January 2013.
Through December 19, the mean temperature in Fairbanks has been -19.4°F. The lowest temperature has been -48°F on December 17.
The latest ensemble forecasts suggest that the EPO could go neutral or negative toward the end of December. The PNA could go neutral or positive (and support for a turn to positive has been growing). The AO will likely remain negative. As a result, the forecast teleconnections suggest that the focus of the cold could shift south and eastward from Alaska into the CONUS and southern Canada. As 2013 begins, the risk of an Arctic outbreak appears likely to increase. One has seen such an outbreak appear on a few of the recent runs of the GFS for the start of January (including today’s 12z run).
***********************************************************************************************************************************
Posted Tuesday, December 18th @ 10:49 PM
In Message #243, I talked about why I believe winter 2012-13 is not likely to be a repeat of the non-winter of 2011-12.
Last winter, week after week, most of the guidance and the ENSO-teleconnection analogs were painting warm outlooks. After a pause following November, the scenario is a cold one.
Below are the latest monthly forecasts for January 2013 from the CFSv2 and also what’s showing up on the analogs for January 1-7, 2013 coupled with the month as a whole for those analogs. Notice how similar the CFSv2 and analog ideas for January are.
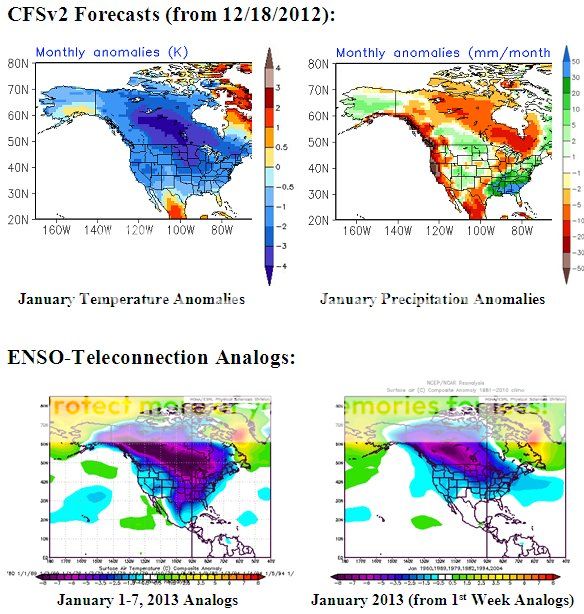
The ENSO-teleconnection analogs are based on ENSO Region 3.4 anomalies in the -0.35°C to +0.40°C range, AO in the -3 to -1 range, and the PNA in the -1 to 0 range for January 1-10, 1950-2012. The analog years that came up were 1960, 1969, 1979, 1982, 1994, and 2004. March 1960, February 1969, February 1979, April 1982, and February 1994 had KU snowstorms. January 2004 had a major snowstorm in the Plains States and a massive lake effect snowstorm.
***********************************************************************************************************************************
Posted Sunday Evening, December 16, 2012 at 10:40 pm
Pattern Change Now Evolving as Panic of December ’12 Rises….
The storm that brought record daily snowfall to Minneapolis-St. Paul commenced a sequence of events that is leading to a pattern change. That sequence of events will likely include two systems (one underway and another in coming days) that will be noted more for wet than white in the East. Afterward, the last 10-14 days (14 days for the Plains States and 10 days for the East Coast) could see generally cooler than normal weather.
The rising panic that Winter 2012-13 is becoming a repeat of the non-Winter of 2011-12 has resulted for a large gap between the actual pattern change that is now imminent and expectations. The pattern change was likely to be slow with a fairly lengthy transition before sustained colder weather set in. Given the combination of an EPO+, PNA-, and persistent Arctic warmth, severe cold was not very likely for much or all of December. Expectations were for prolonged and deep cold to set in with the potential for excessive snows. That gap was unsustainable, hence the rising panic.
If one steps back to take a look at the non-Winter of 2011-12, one finds:
1. A powerful AO+ regime predominated in December.
2. The long-range guidance and analog cases were unrelenting with their warm idea.
3. The subtropical jet was quiet.
To date, one finds:
1. A persistent AO- regime.
The AO has now been negative for 22 consecutive days. It is likely to remain predominantly negative for the remainder of the month as per the ensemble guidance and also historic cases. Notable long-lived blocks that developed in the 11/20-12/10 timeframe have typically been long-lived. Put another way, the blockiness that was present in mid-Autumn reasserted itself during the winter.
Recent examples include the blocking regimes of 2009-10 and 2010-11. The following severe blocking episodes (minimum AO value of -3.000 or below) began in late November/early December (11/20-12/10) following a blocky October (monthly AO of -025 or below):
December 7, 1966-January 11, 1967: 36 days
December 7, 1981-January 12, 1982: 37 days
November 29, 2009-January 15, 2010: 48 days
December 3, 2010-January 15, 2011: 44 days
All four of those cases saw the January AO average < 0. KU snowstorms occurred during the winter in 1966-67, 2009-10, and 2010-11. A KU snowstorm occurred during the spring in 1981-82,
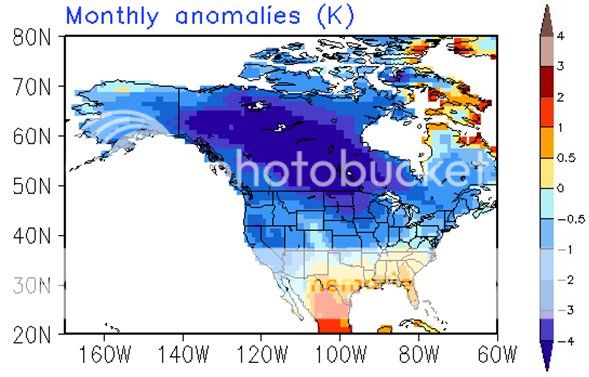
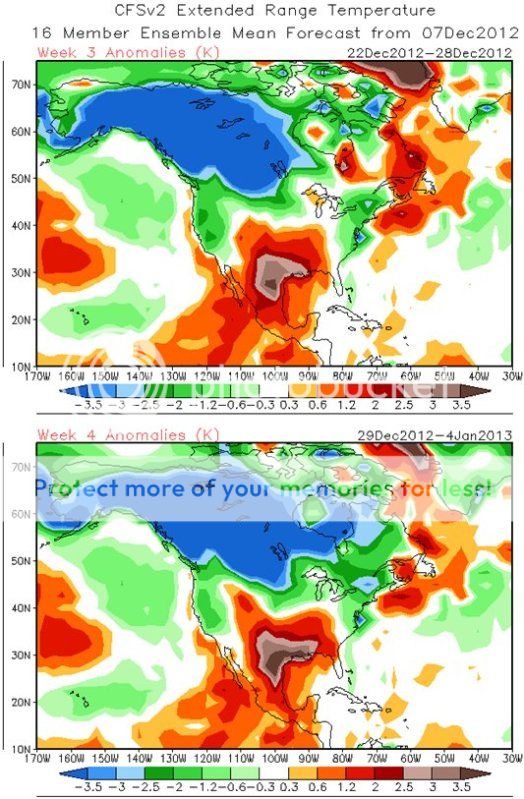
2. The long-range guidance has been anything like last winter. In fact, the latest CFSv2 guidance has trended toward widespread cold to begin January and a generally cold month across much of North America. With the PNA having been negative for 41 consecutive days, both historic cases and some ensemble members suggest that it could go positive near or during January. Once that happens, the dam that has kept some of the coldest air bottled up in Alaska and westward could break and a genuine prospect of at least an outbreak of severe cold could develop.
Below are the latest CFSv2 weekly (weeks 3 and 4) and monthly (January 2013) forecasts:
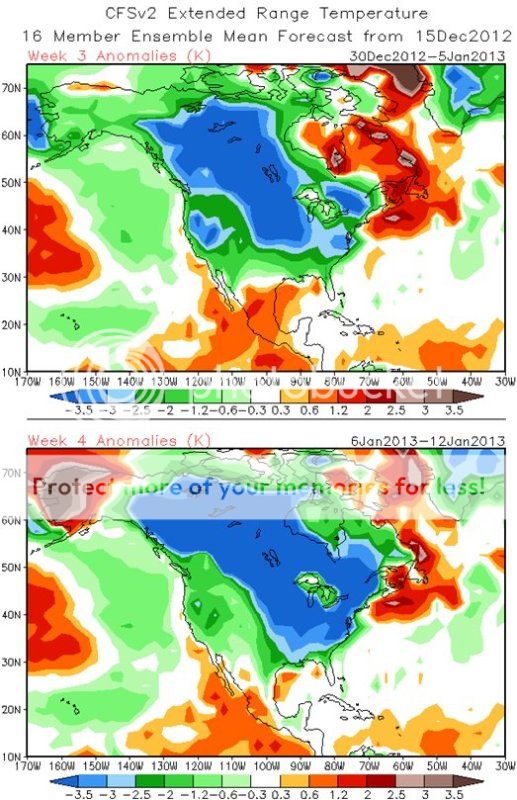
3. The SOI has recently gone negative. December 10-12 had values below -40. The 30-day moving average has gone negative and the 90-day moving average is near 0. Often such developments suggest a stronger subtropical jet. Hence, there is a possibility that the closing 10 days of December and perhaps the opening 10 days of January could be stormy.
In sum, the gradual pattern change is unfolding. At first, the cold will be a little more impressive than seasonal cold. Storminess could increase as well. The possibility of an outbreak of severe cold could increase after the start of January, as the PNA heads to more neutral values,and especially if it goes positive. All said, even as the first two weeks of December have been sufficiently warm to rekindle nightmares of the non-Winter of 2011-12, there are big differences that argue against a repeat.
***********************************************************************************************************************************
Posted Today, December 15, 2012 at 2:39 PM
Some Weekend Thoughts….
The anticipated but slow transition to sustained colder weather in eastern North America is underway. I suspect when one looks back, the storm that brought daily record snowfall to Minneapolis-St. Paul on December 9-10, 2012 marked the very beginning of a slow, back-and-forth transition. Even as this week’s events, excepting northernmost New England and parts of Quebec will likely see little frozen precipitation, they will mark the end game of the transition. By 12/20 +/- a day, the transition will likely be complete. The remainder of the month will generally be colder than normal in the eastern half of North America.
With a more active subtropical jet, there will be a risk of storminess. With the cold getting established, opportunities for snowfall in the Great Lakes region, Ohio Valley, Middle Atlantic States, New England, and southern Ontario and southern Quebec will increase. There could be a possibility of a moderate or even significant snowfall in part of that region.
Some guidance has even hinted at a brief outbreak of severe cold. For example, the 12/15 0z run of the GFS showed a low temperature of 3°F in New York City for 12/29. That would be the first December single-digit reading there since December 27, 1989. The 6z run showed a temperature as low as -32°C (-26°F) in Ottawa.
Given the generally positive EPO, I don’t believe such an outbreak is likely this month (and the 12z GFS backed off on the extreme cold). One cannot rule out a day or two with low temperatures in the teens from Philadelphia into New England and a low temperature of -20°C to -15°C in Ottawa.
As the month ends, blocking is more likely than not to persist. Some ensemble members are hinting that the PNA, which has now been negative for 40 consecutive days, will go positive toward the end of December. That might set the stage for a bout of more significant cold in early January, but that’s still too far out for one to have much confidence.
***********************************************************************************************************************************
Posted Today, December 8, 2012 at 06:10 PM
Hints of Change to a Colder Pattern Growing Stronger…
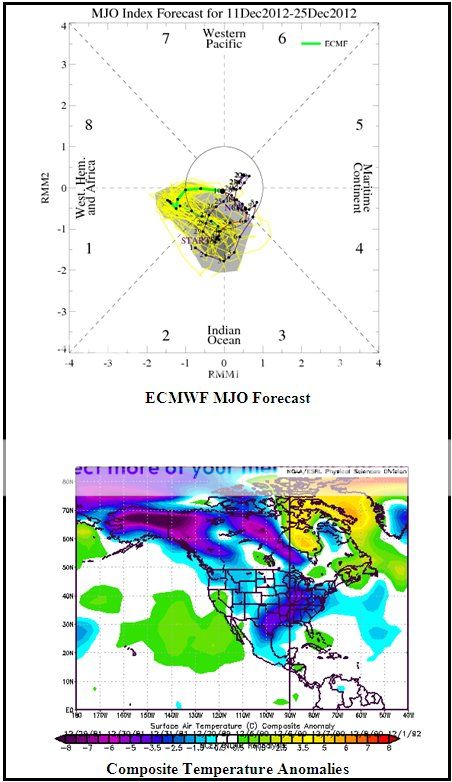
If one examines the ECMWF forecast for the MJO, the MJO is forecast to move into Phase 1 by late December. The composite anomalies are cold across much of the nation when that happens in December with ENSO Region 3.4 anomalies similar to where they are today (second map for ENSO Region 3.4 Anomalies of -0.25°C to +0.50°C in December with the MJO in Phase 1 and Amplitude 1 or greater).
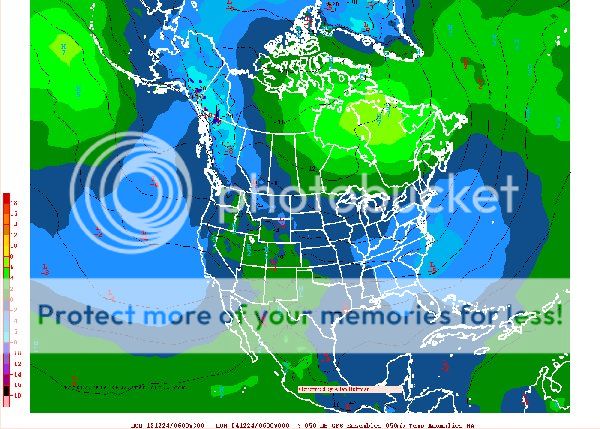
The 12/11/2012 18z run of the GFS ensembles (from RaleighWx’s model page) shows widespread cool anomalies at 300 hours not dissimilar to what one would expect were the MJO forecast to verify.
Some guidance is also hinting that the EPO could go negative in the extended range. That could bolster prospects for the development of a cold pattern.
Finally, with the SOI remaining strongly negative, there remains a growing prospect that the development of the cold pattern could coincide with an increasingly active subtropical jet. If so, prospects for snow could increase during the closing 10 days of December.
***********************************************************************************************************************************
Posted Today, December 8, 2012 at 06:10 PM
A quick evening note:
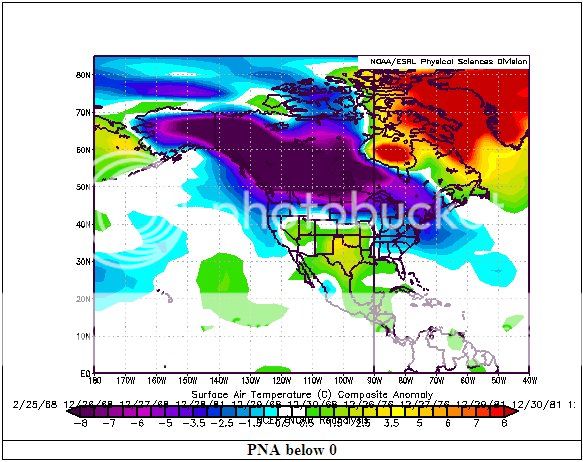
he most recent CFSv2 forecast for Weeks 3 and 4 bears similarities to the AO/PNA- cases.
CFSv2:
AO & PNA- Cases:
***********************************************************************************************************************************
Posted Today, December 8, 2012 at 8:49 PM
Some morning thoughts…
1. The AO has now fallen below -3. It currently stands at -3.055.
2. The PNA has now had its 33rd consecutive negative reading. The guidance shows the PNA remaining negative through the 16-day forecast period. For those who are interested, the PNA once had 81 consecutive negative readings (February 28, 1967 through May 19, 1967).
3. The NAO remains negative and there is strong agreement among the ensemble members that it will fall below -1.000 around December 20.
It’s probably around that time that a colder–not exceptionally cold–pattern could lock into a portion of eastern North America. The evolution toward a cooler pattern should start farther west.
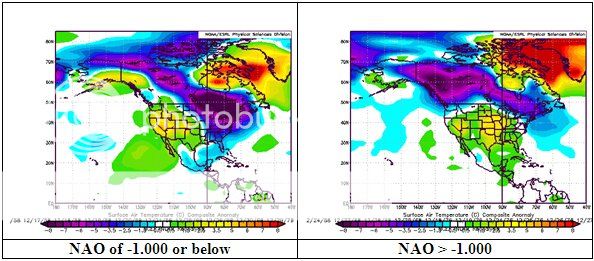
Below are composite temperature anomalies for all December cases where the AO was -3.000 or below categorized by cases where the NAO was above -1.000 and those where it was -1.000 or below with ENSO R3.4 anomalies of 0.0°C to +0.7°C. In total, there were 136 days in December when the AO was -3.000 or below regardless of ENSO. Just 4 (2.9%) of those days saw the NAO above 0.000, therefore I didn’t create a map for the tiny subset of days with a positive NAO. Nevertheless, that tiny handful of days saw warmth on both the West and East Coasts with cold in the Plains States and across much of Canada.
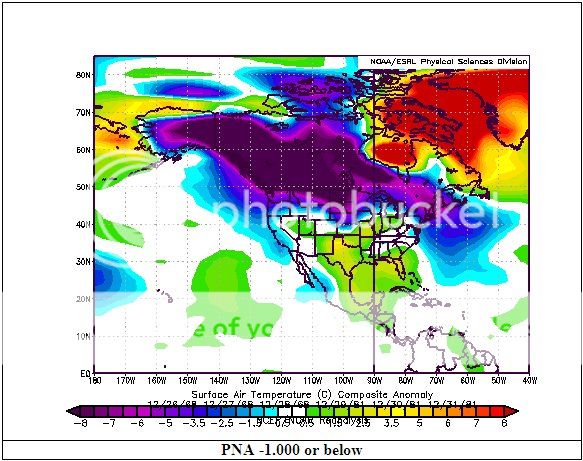
Finally, below are again the maps for PNA <0 and PNA of -1.000 or below for AO cases where the AO was -3.000 or below:
***********************************************************************************************************************************
Posted Today, December 3, 2012 at 9:20 PM
Some morning thoughts…
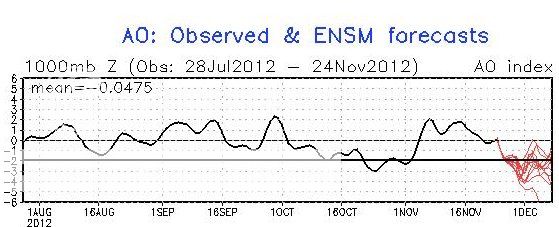
1. The AO had risen to -0.627 today, but is forecast to dive to strongly negative levels in coming days. Within a week, there is strong ensemble support for a figure at or below -3.000. Some ensemble members take the AO below -4.000.
2. While there have been some exceptions where strong or persistent blocking failed to translate into colder weather in parts of eastern North America, those cases have typically been the exception. December 2001 is one such case. However, coming into December there was more cold air available then there was in 2001 across Canada out to Asia.
3. The current pattern is quite similar to the December 7-9, 1980 case. Similar to that timeframe, temperatures are forecast to soar. Much of the Ohio Valley, Mid-Atlantic, and New England regions will likely see high temperatures top out 1.5-2.5 standard deviations above normal (the largest anomalies being in the norther parts of those areas). Southern Ontario, including Toronto, and southern Quebec could see a high temperature more than 2 standard deviations above normal over the next day or two.
For purposes of comparison, the following are the 1.5-2.0 standard deviation anomalies for the December 1-10 timeframe (1981-2010 base period) for select cities:
Boston: 59°-64°
New York City: 61°-66°
Philadelphia: 63°-68°
Washington, DC: 65°-70°
The 12/3/2012 0z MOS (MAV and MET) forecasts show the following ranges:
Boston: 55°-57°
New York City: 62°-66°
Philadelphia: 64°-66°
Washington, DC: 67°-68°
My guess is that Boston could reach or exceed 60° (probably Wednesday) and Washington, DC has a chance to reach 70° (probably tomorrow).
The 1980 pattern later flipped to a colder one. Having said that, there are enough differences e.g., the pronounced warmth in the Arctic region and the forecast for a positive EPO that suggest that the colder pattern probably won’t produce severe to extreme cold. Hence, despite mixed guidance, I still expect a transition to colder weather to begin sometime during the second week of this month. The last 10-14 days of December would probably wind up generally colder than normal, but severe cold probably won’t occur during that time frame. Snowfall opportunities could increase for the Great Lakes/Ohio Valley/Mid-Atlantic/Northeast during that colder period.
In the meantime, while the U.S./southern Canada await the turn to colder weather, the siege of cold is likely to hold for much or all of the next 10-14 days in Western Europe. The same holds true for parts of East Asia, though some moderation could occur later in the time frame depending on the evolution of the Pacific pattern.
******************************************************************************************************************
Posted on December 1, 2012 at 10:01 PM
Stronger Hints of a Blocking-Driven Pattern Change?
With strong blocking continuing and with blocking likely to continue through much or all of the medium-term (excepting for a few ensemble members), one typically would expect to see the beginning of a pattern change to colder in parts of eastern North America. I’ve speculated that the transition could begin sometime during the second week of December (#19 and #25) but the risk of error of being too fast probably outweighs the risk of my being too slow. The month last 10-14 days of the month probably will wind up colder than normal in a large part of the East if my thinking is right.
The upcoming bout of exceptional warmth does not change things. Such warmth has occurred in the past in patterns that later flipped (eg. December 7-9, 1980 was referenced).
The latest guidance lends some confidence that a pattern shift is becoming more likely. Timing questions abound and the timing shown on the guidance is not a high confidence proposition.
First, if one takes a look at the NAEFS (12/9-15/2012 forecast), one finds more moderate probabilities of warmth in the East. A look at the 12/1/2012 0z GFS ensemble forecast finds similar anomalies early in the NAEFS’s forecast period.
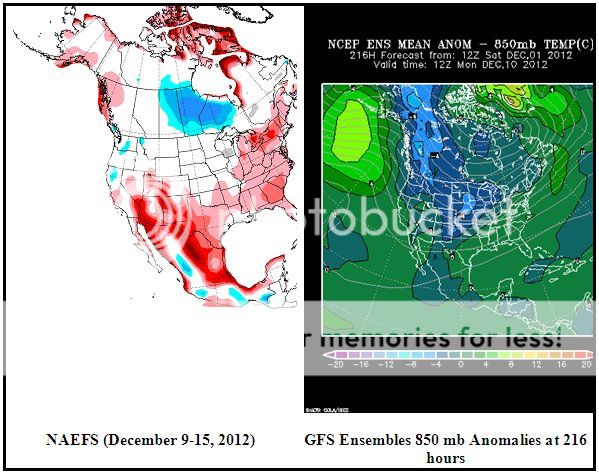
However, the GFS ensembles are transitioning toward a trough in the East/cold in the East. By 360 hours, the trough and cold anomalies are a prominent feature on the GFS ensembles.
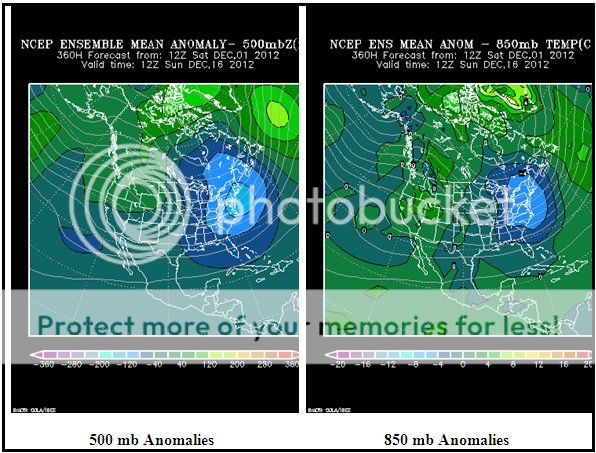
The subsequent 6z run had a similar outcome. So if the GFS ensembles are right, the NAEFS forecast does not necessarily indicate no change in the pattern. Rather, the probability of warm anomalies overall for the period in question might well reflect early warmth that outduels the arrival of colder air.
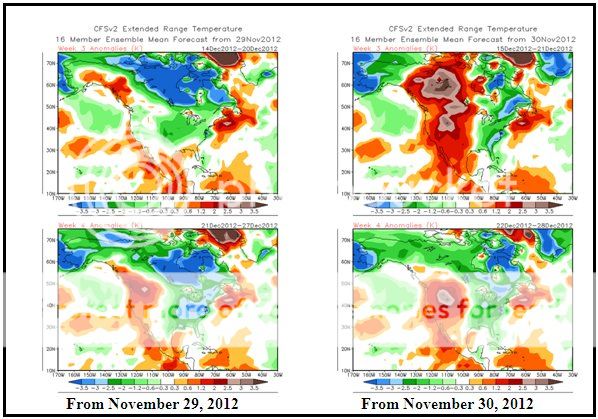
Finally, the last two runs of the CFSv2 anomalies have shown cold anomalies in a significant part of eastern North America.
Overall, my confidence in the idea of a pattern change has increased. Timing questions remain, as does uncertainty. At least we’re not looking at a winter 2011-12 scenario where week after week passed with little prospect of anything more than transient cold.
***********************************************************************************************************************************
Posted November 24, 2012 at 3:27 PM
Winter 2012-13 Thoughts…
Last winter saw a lot of discussion in the thread dedicated to medium- and longer-range thoughts for the winter despite what turned out to be an abysmal winter for many of us. I will be starting a thread dedicated to the coming winter. In this initial message, my winter 2012-13 thoughts are provided.
Overall, I expect winter 2012-13 to experience below normal and near normal readings across the eastern third of the United States, as well as central Ontario and central Quebec southward. Alaska and adjacent areas in Canada will likely wind up colder than normal. The Pacific Northwest will likely experience near normal temperatures for the winter. The remainder of the U.S., along with northern Canada and Canada’s Atlantic Provinces will likely see warmer than normal readings. Northern Canada and the Desert Southwest could have the warmest anomalies.
Snowfall should return to near normal figures for the Great Lakes, Ohio Valley, northern Mid-Atlantic, and southern New England regions. Unlike last winter, the potential exists for a Kocin-Uccellini-type snowstorm at some point during the winter on account of the blockiness.
In terms of precipitation, the western half of the U.S. and southern Canada will likely see near to above normal precipitation. The Gulf Coast and Southeastern States could see below normal precipitation.
Last year saw a powerful positive Arctic Oscillation (AO+) become the primary synoptic driver. This winter, no single teleconnection appears likely to predominate. However, the potential for significant blocking suggests that the AO will probably be a major player.
Key Assumptions:
• Borderline-to weak El Niño conditions through much of the winter
• PDO- (near neutral PNA signal for the winter)
• A blocky winter with the potential for several extended periods of substantial blocking (AO)
At this point in time, there are some encouraging signals that lend confidence in the overall winter idea, despite a grim CFSv2 forecast.
Blocking:
The summer AO averaged -0.163. Since 1950, there were 38 cases during which the summer AO averaged < 0. 26/38 (68.4%) saw the winter AO also average < 0.
In cases when the summer AO averaged < 0, a winter AO < 0 was 1.4 times more likely than an AO > 0 during El Niño events. Winter 2009-10 was the most recent El Niño case that saw a negative winter AO.
In contrast, during those 38 cases, a winter AO > 0 was 2.9 times more likely than an AO < 0 during a La Niña. Winter 2011-12 was the most recent La Niña case that saw a positive winter AO.
More recently, the AO averaged -1.514 during October. Since 1950, there were 8 prior cases during which the AO averaged -1.000 or below during October. 6/8 (75%) saw the winter AO average < 0.
From that pool of 8 cases, 4 saw the AO fall to -2.000 or below during the December 1-10 period, as is forecast to occur by a majority of ensemble members.
All four (1966, 1981, 2002, and 2009) saw the AO average < 0 during the winter. 3/4 (75%) of those winters experienced a KU snowstorm. The exception (winter 1981-82) saw a springtime KU snowstorm (the April 1982 blizzard).
Since 1950, there were 20 KU snowstorms during the December-February period when the ENSO Region 3.4 anomaly was > 0. 18/20 (90%) commenced when the AO was < 0. 13/20 (65%) commenced when the AO was -1.000 or below.
Regional Hint from November Snowfall(s):
To date, November 2012 has seen 4.7” snowfall in New York City. There were six such cases since 1869: 1882, 1892, 1896, 1898, 1938, and 1989. 5/6 (83%) saw an additional 24.5” or more of snow accumulate during the season and 4/6 (67%) saw 30” or more additional snow. The single exception was winter 1989-90, which came to an abrupt end after a cold, snowy start. Among the leading analogs appearing for December is 1968 and 1977. In addition, all four December cases (1958, 1977, 1980, and 1981) with an ENSO Region 3.4 anomaly between 0.00 and +0.75 and a December 1-10 AO reading that fell to -2.000 or below saw generally cold winters in the East, though January-February 1959 was mild in the Mid-Atlantic and Southeastern regions. Consequently, I am reasonably confident that winter 2012-13 is not likely to be a replay of 1989-90.