
Good Everyone,
Finally got the dashboard updated below. The format was cleaned up. The theme from looking over the data is that once we get passed this week, the week of February 22nd and into the first week of March look to favor more winter weather threats. Basically, this means the potential is there for East Coast Winter Storms. Way too early to get into details, especially for the system on the 24/25 timeframe, especially how much snow expected, how cold will it be. The big picture is that a low will develop over the Southeastern US and move up the coast. Definitely interesting times ahead for sure.
| Telleconnection Indice Dashboard Forecast Thursday, February 18th through Monday, February 22nd (1 to 6 Outlook) |
|||
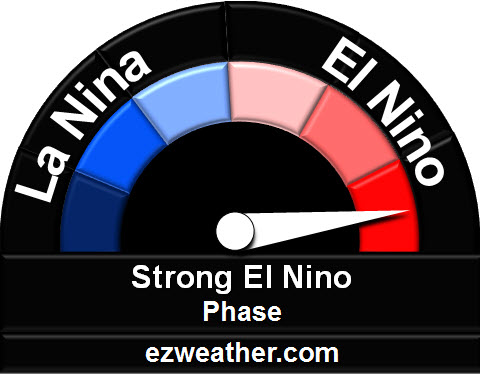
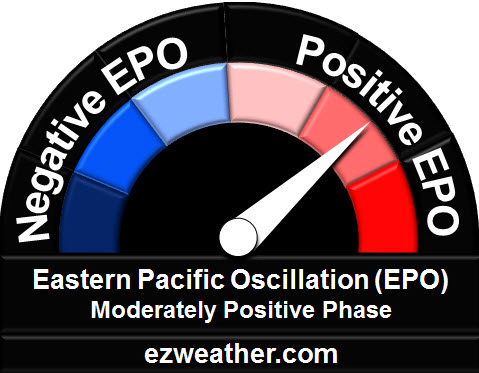
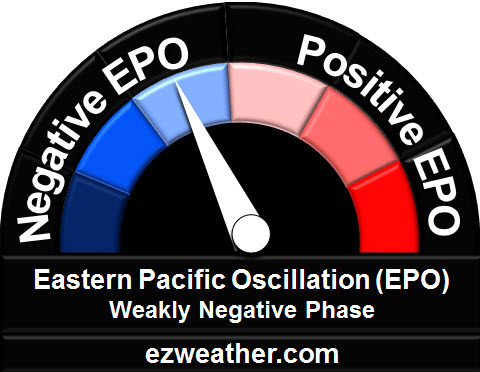
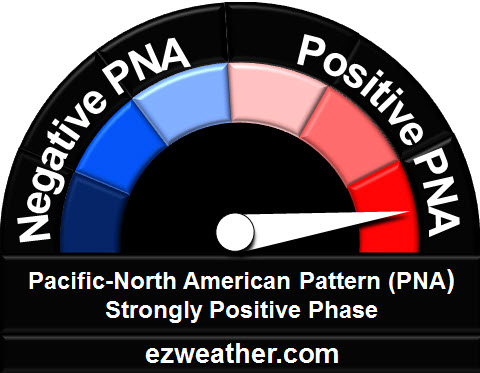
| Pacific Region |
|||
 |
 |
 |
|
| Basics – Click here Australian Site click here |
Basics – Favorable, Not Favorable | Basics – Click here | |
| Not Favorable |
Not Favorable | Favorable | |
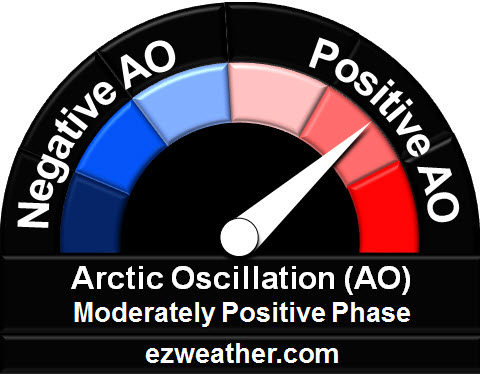
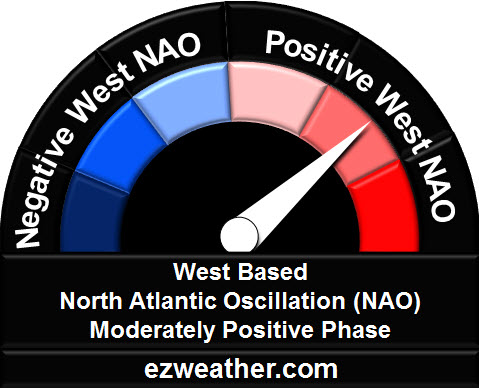
| Atlantic Region | |||
 |
 |
 |
|
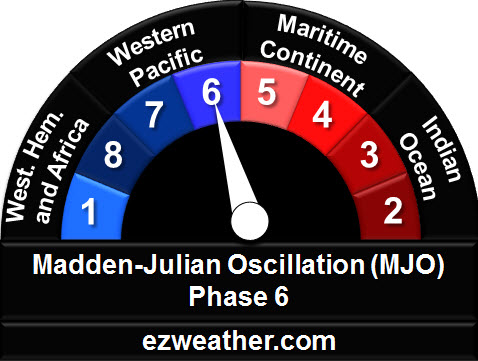
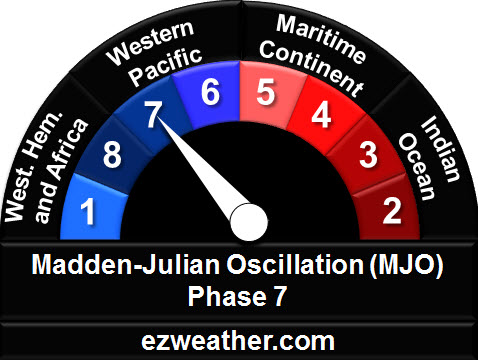
| MJO Composites – Click here (Check out Kyle MacRitchie Website) and here |
Basics – Click here | Basics – Click here | |
| Not Favorable |
Not Favorable | Not Favorable |
|
| Model Ensembles GFS (GEFS) vs European (ECMWF) |
|||
 |
 |
 |
|
|
Mon, Feb 17 – Mon, Feb 22
|
Monday, February 17th
|
Monday, February 22nd
|
|
 |
 |
 |
|
| Mon, Feb 17 – Mon, Feb 22 | Monday, February 17th | Monday, February 22nd | |
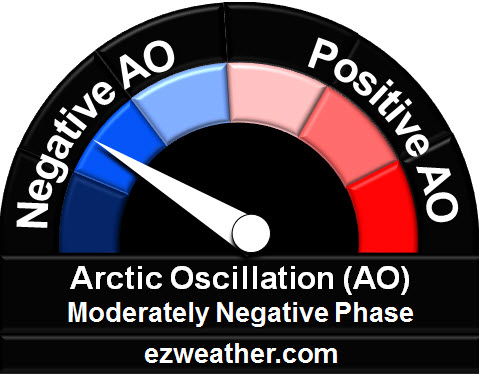
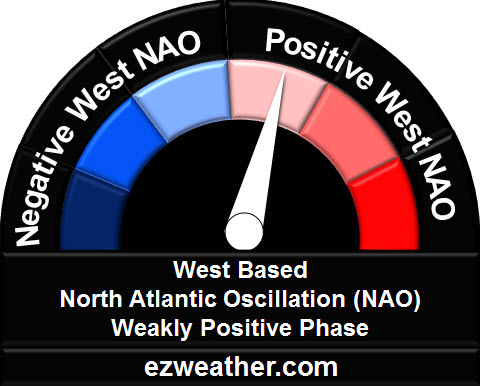
| Summary: For this forecast period, not expecting much in the way of any winter weather. Basically, the upper air pattern based up on the indices and model ensembles seems to favor a gradual building of the ridge over the Western US and a trough over the Eastern US. The main theme for this period will be a quiet one and not expecting much in the way of any major storms, especially for winter weather. | |||
| Telleconnection Indice Dashboard Forecast Tuesday, February 23rd through Sunday, February 28th (6 to 10 Outlook) |
|||
| Pacific Region | |||
|
 |
 |
|
| Basics – Click here Australian Site click here |
Basics – Favorable, Not Favorable | Basics – Click here | |
| Not Favorable | Favorable | Favorable | |
| Atlantic Region | |||
 |
 |
|
|
| MJO Composites – Click here (Check out Kyle MacRitchie Website) and here |
Basics – Click here | Basics – Click here | |
| Not Favorable | Not Favorable | Not Favorable | |
| Model Ensemble Comparison Maps GFS (GEFS) vs European (ECMWF) |
|||
 |
 |
 |
|
|
Mon, Feb 22 – Sat, Feb 27
|
Monday, February 22nd | Saturday, February 27th | |
 |
 |
 |
|
| Mon, Feb 22 – Sat, Feb 27 | Monday, February 22nd | Saturday, February 27th | |
| Summary: This forecast period bears watching. Based upon the indices and model ensembles, an upper air pattern that favors Western US ridging, which looks to be very significant and downstream to the Eastern US, a deep trough. Model guidance has been indicating the potential for a significant storm to develop along the East Coast. The signal is there for a significant storm. The period looks to be from the 23rd to the 25th. The GFS has been favoring a warm solution, meaning a storm that brings more rain versus snow whereas the European model favors a potential winter storm. The one item is the Western Based NAO. This indice looks to remain positive, so there the storm could track inland versus offshore. For now, its a period that favors a significant storm. Definitely stay tune. One additional note, colder temperatures are likely for this period, so it certainly will feel more like winter again. | |||
| Telleconnection Indice Dashboard Forecast Monday, February 29th through Saturday, March 5th (10 to 15 Day Outlook) |
|||
| Pacific Region | |||
|
|
|
|
| Basics – Click here Australian Site click here |
Basics – Favorable, Not Favorable | Basics – Click here | |
| Not Favorable | Favorable | Favorable | |
| Atlantic Region | |||
|
|
 |
|
| MJO Composites – Click here (Check out Kyle MacRitchie Website) and here |
Basics – Click here | Basics – Click here | |
| Favorable | Favorable | Not Favorable | |
| Model Ensemble Comparison Maps GFS (GEFS) vs Canadian (GEMS) |
|||
 |
 |
||
| Saturday, February 27 through Thursday, March 3 | |||
 Anomaly Map |
 Anomaly Map |
||
| Saturday, February 27 through Thursday, March 3 | |||
| Summary: For this forecast period, based upon the indices and model ensembles, we have a well established West Coast ridge and an Eastern US trough. This period favors some potential for the development of East Coast lows, which may indicate winter storms. Definitely a period that favors more winter weather. Temperatures look to be below average for this period. The one indice for the Atlantic, which is the Western Based NAO, may finally approach neutral or even negative during this period. The same for the MJO phase as well. So, this period is one that could deliver more winter type weather. Definitely stay tune. So, thats pretty much it. | |||
| Background Info One additional point and worth mentioning, this experimental forecast product is focused for the Eastern US. Right now, I’m going to focus on the Philadelphia Area for now, but you can apply this elsewhere such as the Middle Atlantic and Northeast US. Just wanted to make sure everyone is on the same page. I’m introducing a new blog that will be focused on identifying future winter weather patterns (i.e., winter storms). One of the things I’ve really gotten interested in using is telleconnection forecasting. Basically, it consists of indices that involve whether ridging will take place over the Western US, arctic air available for the Eastern US to blocking over Greenland. Its these factors that hold the key on whether a weather pattern is favorable for winter weather.One of the excellent long range forecasters I’ve been following for a while is Dave Toleris. If you want to learn how all this works, I highly recommend anyone to check out his thoughts on long range weather forecasting. The past year or so, he updated his website. He’s developed a section on his website on Snowstorms. Its what he developed that got me thinking. The table he put together is called North American Telleconnection Pattern Index or N.A.T.P.I. Its a great way to see if a weather pattern will be favorable for winter weather.So, let’s get started. Each table will provide a speedometer like scale showing you the state of El Nino or La Nina, Pacific and Atlantic state, and MJO. I’ve made sure to spell what these are and further background in hyperlinks. I’ll provide a summary statement on whether a forecast period is favorable for winter weather. I’ll be using model data from American Weather and Weatherbell, which includes ensemble model solutions (GEFS, EPS, etc). One final point, as a forecaster, you need to understand how the pattern will evolve and not rush to judgement based on a certain model run. Its very important to see how things are trending versus a model run that shows a winter storm, when the weather pattern doesn’t support that model solution. So, thats a brief overview. If you have any questions, please provide a comment and I’ll be happy to answer your question. |
|||